
Unified Observability
IT, Data Center, utilities and IoT assets brought together in a common monitoring layer.
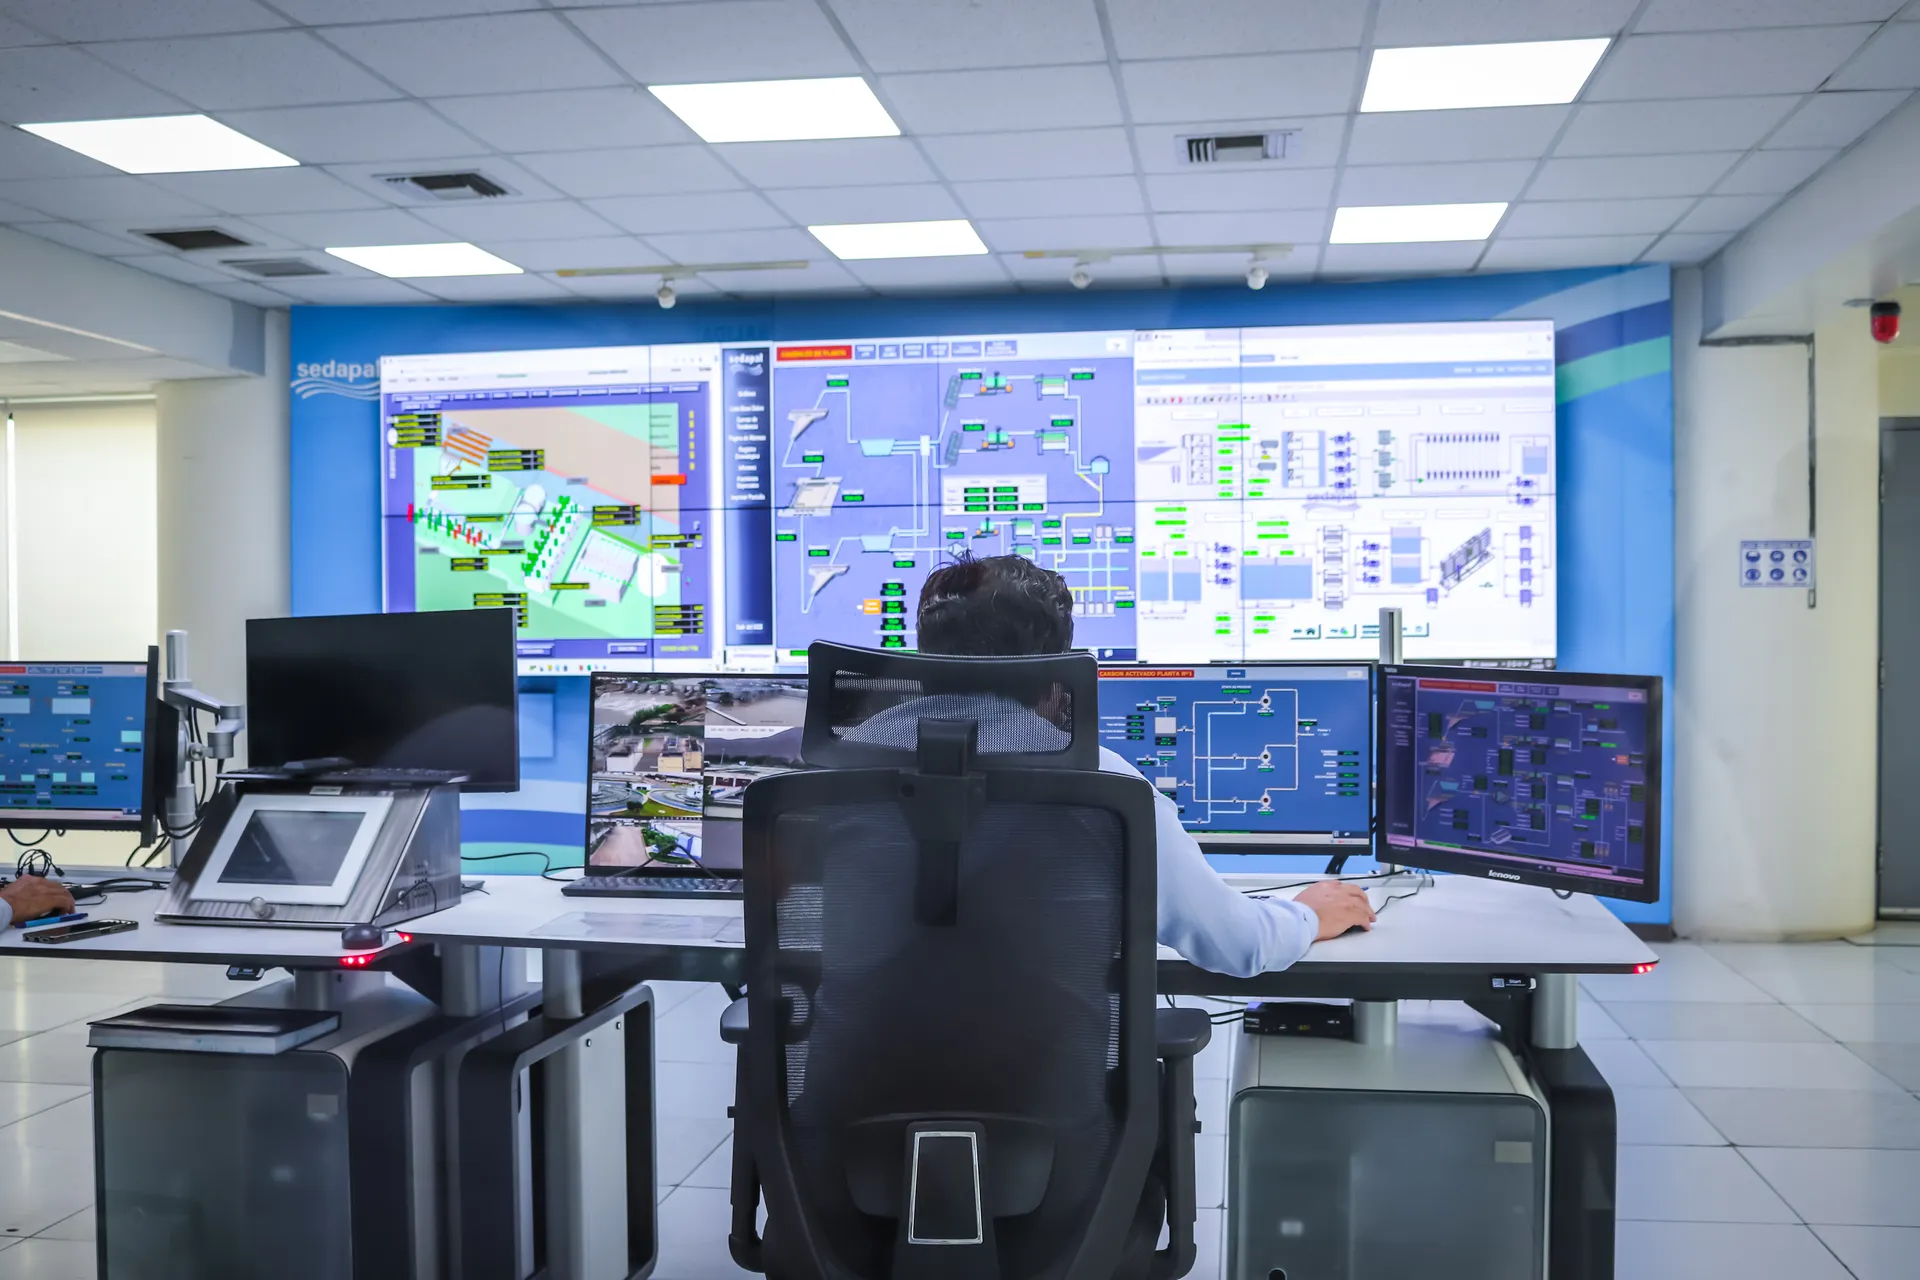
Observability and operational intelligence
Unified monitoring of infrastructure, communications, energy and processes for IT, OT, Data Centers, Industry, Logistics and Agribusiness.
IT, Data Center, utilities and IoT assets brought together in a common monitoring layer.
Events can follow notification, escalation and integration flows with teams and systems.
Dashboards can organize different levels of detail for operations, management and leadership.
OneView was developed by ConsulData to centralize the monitoring, observability, and intelligent management of technology environments and critical operations. Far beyond traditional network monitoring, it integrates IT, OT, Data Centers, telecommunications, corporate systems, utilities, IoT, and operational processes into a single view. Tailored for environments that demand high availability, OneView collects and correlates thousands of events, transforming technical and operational data into clear information for operators, technical teams, and managers. Dashboards, maps, indicators, and intelligent alerts make it possible to identify anomalies, anticipate risks, and act quickly on events that may impact operations. The platform can be used in NOCs, SOCs, CCOs, Data Centers, and Operations Centers, integrating different manufacturers, protocols, and technologies. It can operate in the cloud, on private infrastructure, or on-premises, with an architecture designed for high availability, redundancy, backup, and expansion. OneView transforms complex environments into a single, clear, actionable view, increasing availability, reducing risks, and bringing predictability to operations.
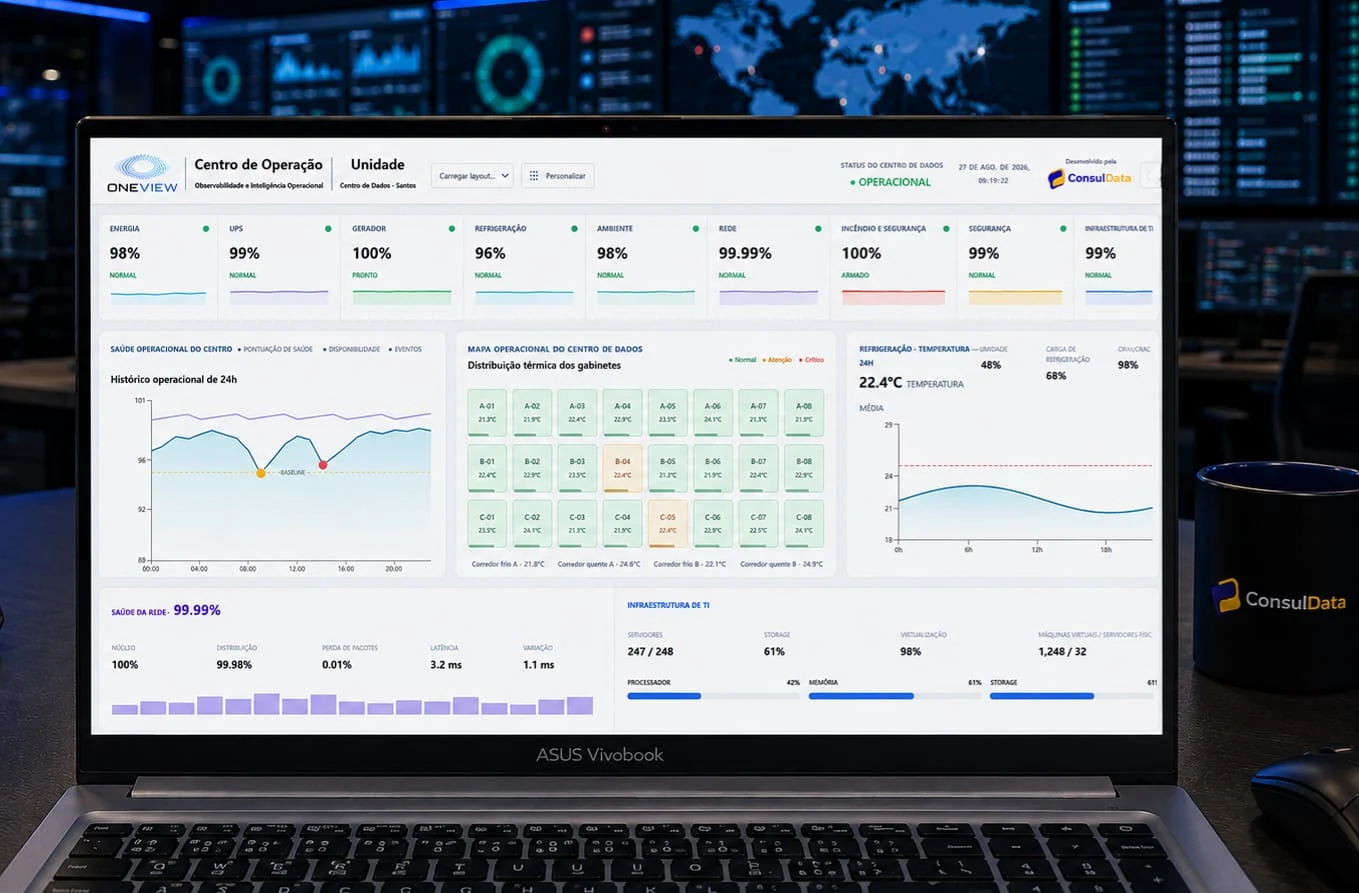
OneView integrates technologies, protocols and operational data to increase visibility and reduce the time between event and action.
Heterogeneous sources share an observability layer capable of organizing context, communication and response.
An integrated reading of technology, infrastructure and process.
Open standards and APIs connect technologies from different manufacturers.
The right information reaches the right audience and process.
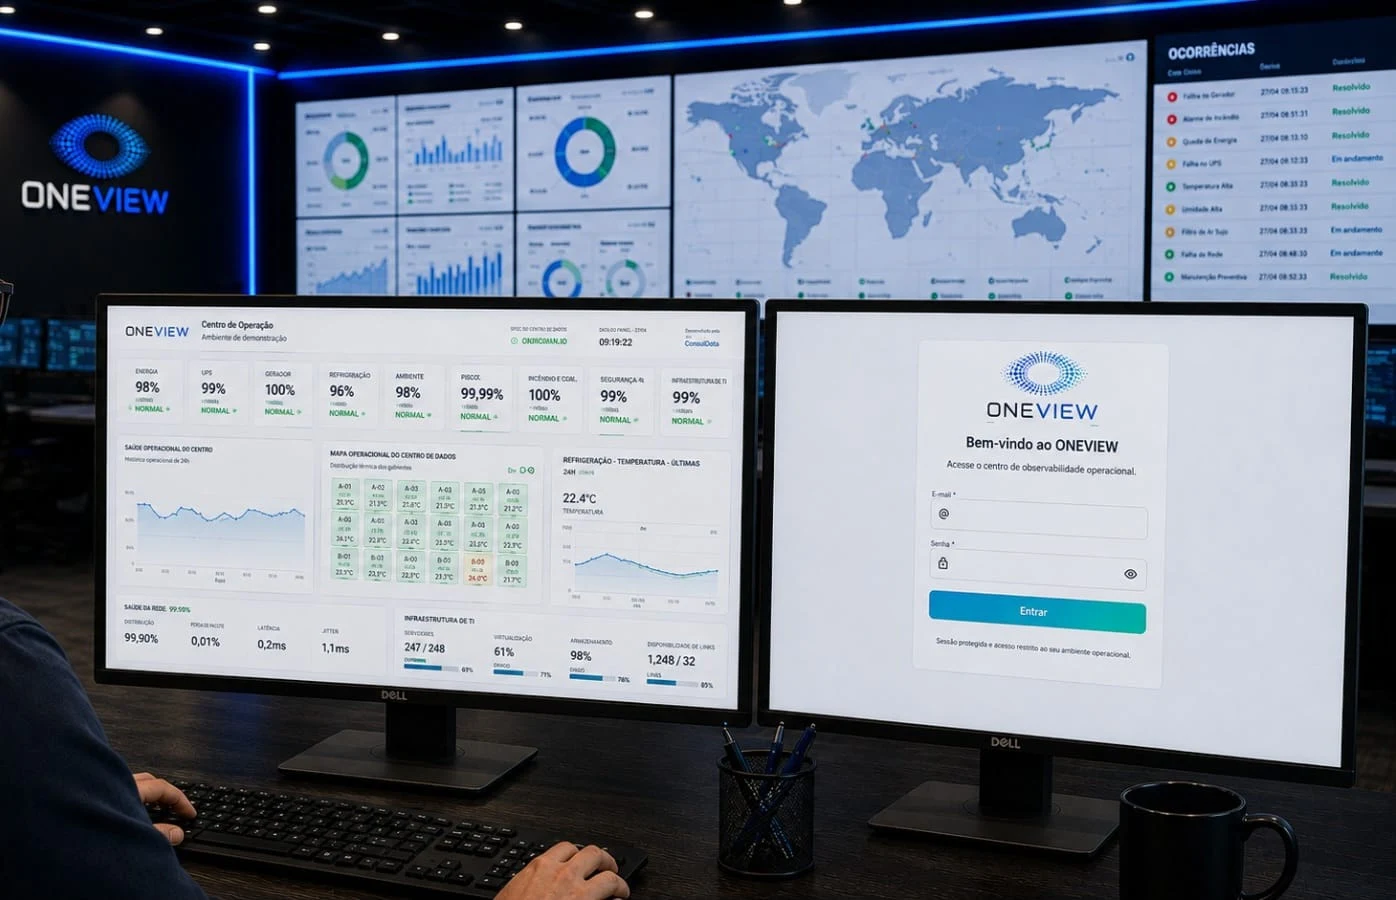
Information from different manufacturers and disciplines shares a common reading.
Trends, bottlenecks and risks can be identified before they become outages.
SNMP, ICMP, SSH, Modbus, MQTT, APIs, Syslog and other means connect diverse environments.
Playbooks and integrations can support corrective actions and opening tickets.
Platform deployed alongside monitored environments.
Centralized architecture in the organization's infrastructure.
Hosting and components sized according to the project.
Monitoring and support defined in contractual service levels.
Integrations, automations, hosting and support are defined according to the contracted scope.
Clear information to guide the next technical conversation.
The scope may include networks, servers, virtualization, storage systems, databases, applications, data centers, power, cooling, IT, IoT, electronic security, and operational processes.
The architecture provides protocols such as SNMP, ICMP, SSH, Modbus, MQTT, Syslog and NetFlow, as well as APIs and integrations specific to platforms and equipment.
You can execute previously defined actions, such as scripts, opening tickets, notifications, escalations and playbooks. Each automation needs to be designed, authorized and tested for the environment.
Talk to our team about your context, requirements, and preferred engagement model.